Author: Roman Savochenko
If you strictly follow the Quick Start manual then you will not encounter any problems, but if you do something yourself then you may need some debugging. OpenSCADA provides extensive opportunities for debugging and identifying programming problems in the overall OpenSCADA user space and the problems of OpenSCADA itself and its parts.
Basic approaches to custom debugging include:
- Creating external attributes to look at intermediate values and monitor the current execution context.
- Creating debugging messages, also for review of intermediate values and follow-up monitoring.
Basic debugging mechanisms have been expanded in the latest versions of OpenSCADA for the subject:
- Custom control over debugging, through the debugging message category for OpenSCADA parts and user space messages.
- Specific debugging and diagnostic environments for some parts of OpenSCADA, such as: data sources (controller objects) and interfaces of VCA (VCA projects).
1 Debugging the current execution context
This method of debugging involves monitoring values of the variables of the execution context, including the addition of intermediate values, for detail.
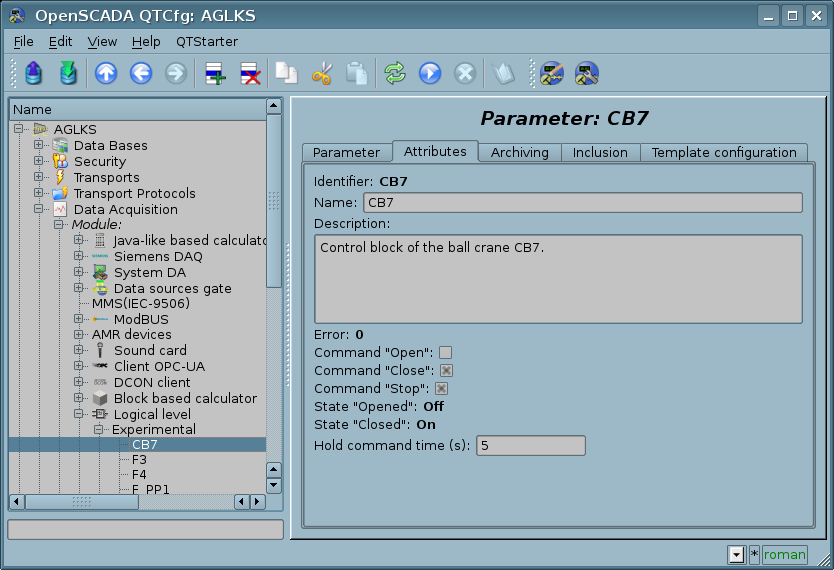
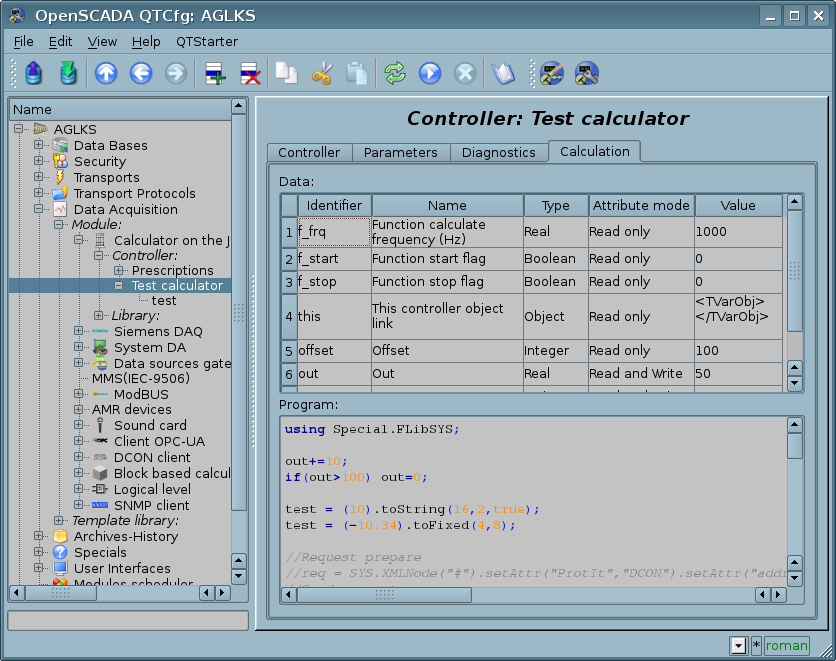
Current execution context of DAQ procedures you can observe into a proper page of the object of the execution context, like: the tab "Attributes" of the Logic Level parameter (Fig. 1), the tab "Calculation" of the Java-like based calculator (Fig. 2) and so on. To append some interim values you can temporary append (or set as an read-only attribute) and link some attributes to the template or append and link some IO to the function.
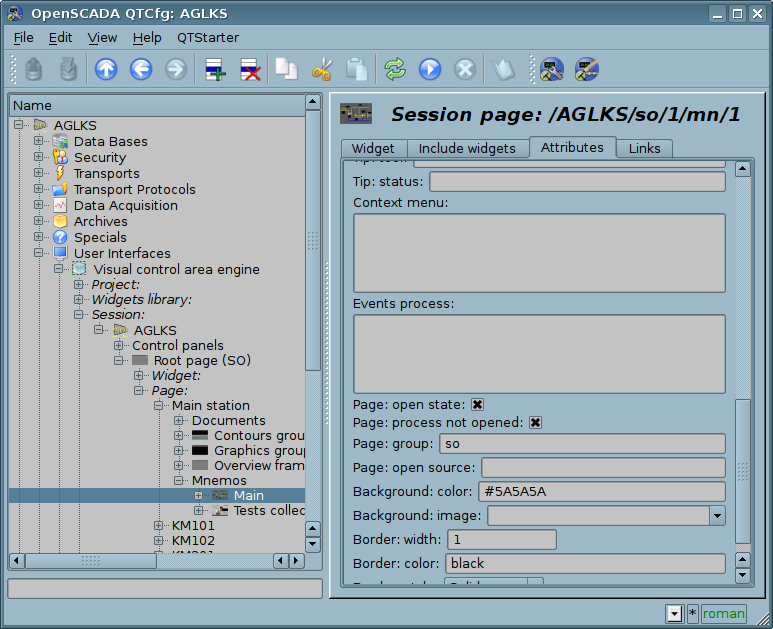
Current execution context of the VCA procedures (procedures of the widgets) you can observe on the tab "Attributes" of the proper page or widget of the session of the executed now project (Fig. 3). To append some interim values you can temporary append and link several attributes to the widget/page.
2 Debugging the execution sequence
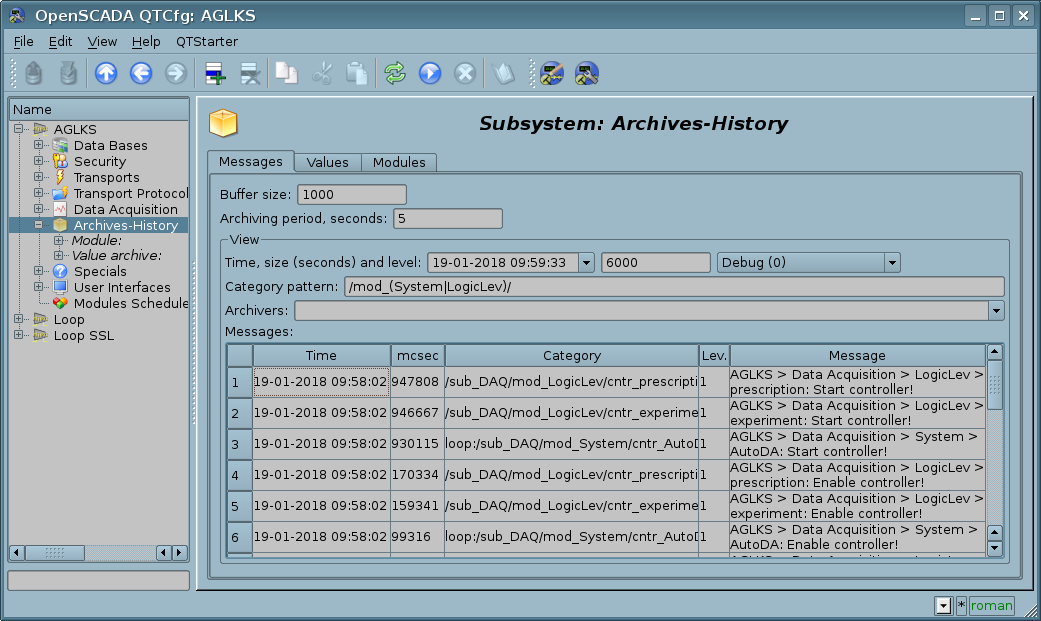
That debugging method means placing and/or enabling debugging messages and next their observing into the generic interface of the messages archiving and observing (Fig. 4) or into the interface proper to the OpenSCADA part:
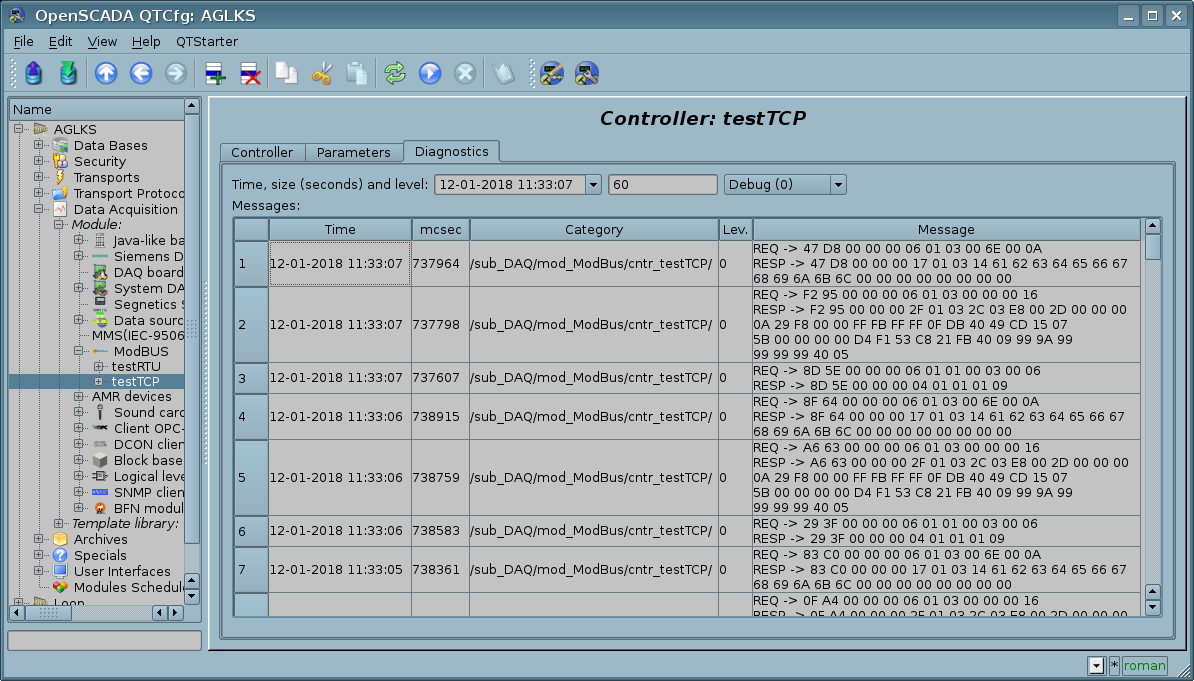
- Tab "Diagnostics" of the controller object of the data source (Fig. 5).
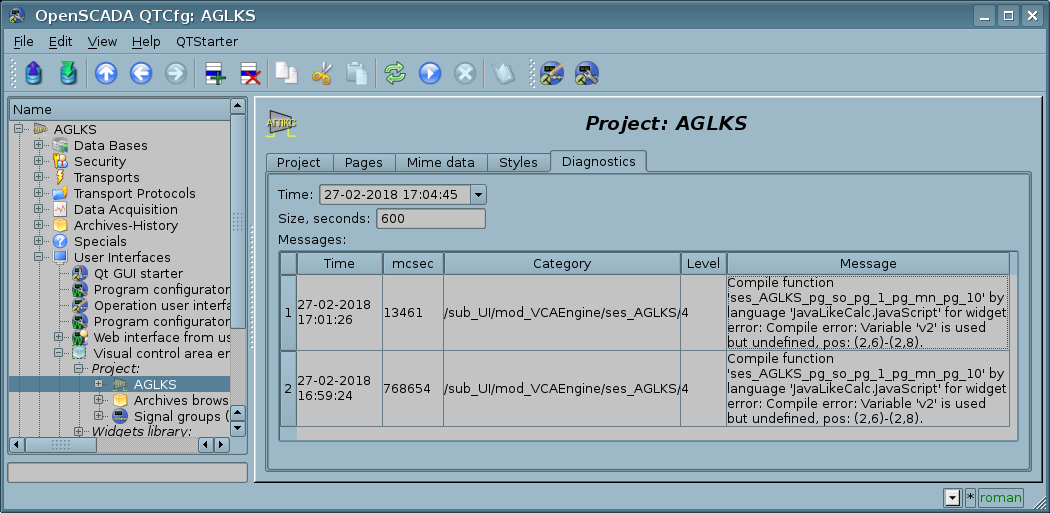
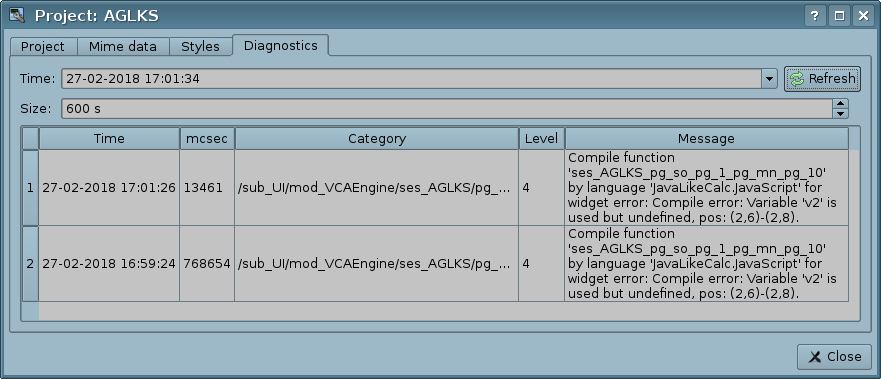
- Tab "Diagnostics" of the project object of VCA into the configurator (Fig. 6) or of the project properties of the development mode of UI.Vision (Fig. 7).
To append messages in debug or other levels to your procedures you can use next functions:
- Generic: SYS.message(), SYS.mess{Debug,Info,Note,Warning,Err,Crit,Alert,Emerg}() — to form generic messages with a custom category, then them mostly allowed to observe from the generic messages archiving and observing interface (Fig. 4).
- Generic: SYS.*.messSys() — to form the system messages of the program with the node path as a category and with the human readable path before the message. The messages will be allowed to observe into the diagnostics interface proper to the OpenSCADA part (Fig. 5, 6, 7).
- VCA: this.mess{Debug,Info,Note,Warning,Err,Crit,Alert,Emerg}() — to form the system message of the program with the category as the widget path. The messages will be allowed to observe into the VCA diagnostics interface (Fig. 6, 7).
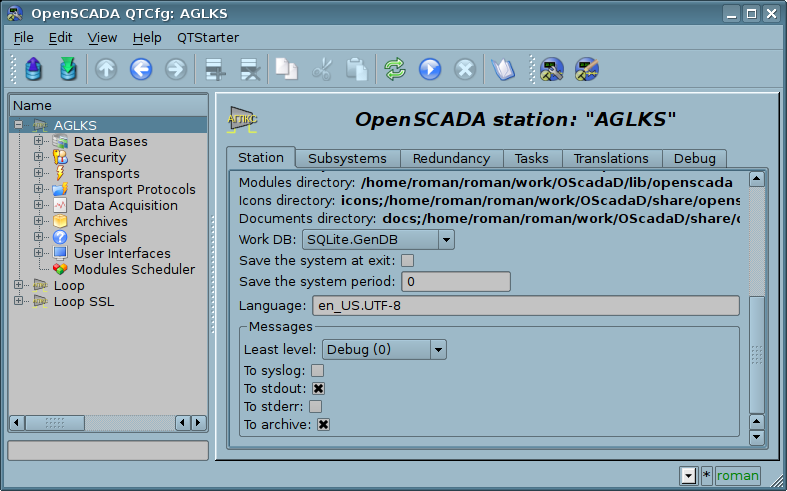
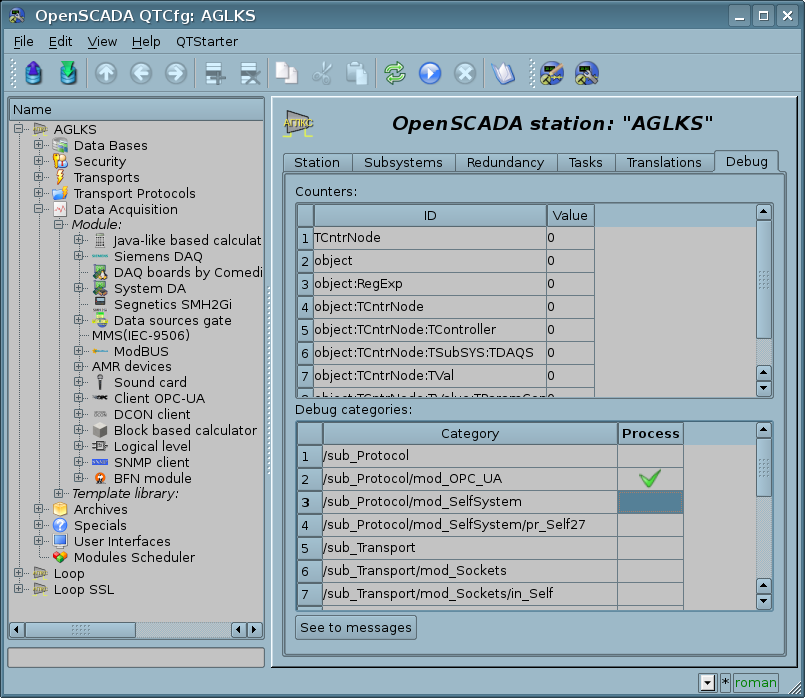
![]() The debugging messages (the suffix is "Debug" or the level is 0), on the last versions of OpenSCADA, will be allowed to observe only after the debugging enabled: the field "Least level" set to "Debug (0)" (Fig. 8) and check category(es) of the messages (Fig. 9), for the details read here! The debugging messages enabling and disabling allows you to include the debug messages permanently into the procedures with the proper category of the place. All other, not debug, messages will show anytime, for levels more or equal to the globally set (Fig. 8).
The debugging messages (the suffix is "Debug" or the level is 0), on the last versions of OpenSCADA, will be allowed to observe only after the debugging enabled: the field "Least level" set to "Debug (0)" (Fig. 8) and check category(es) of the messages (Fig. 9), for the details read here! The debugging messages enabling and disabling allows you to include the debug messages permanently into the procedures with the proper category of the place. All other, not debug, messages will show anytime, for levels more or equal to the globally set (Fig. 8).
![]() The internal or system parts of the controller object of the data source are enabled independently for diagnostics by setting the "Level" property to "Debug (0)" on the appropriate diagnostic interface (Fig. 5).
The internal or system parts of the controller object of the data source are enabled independently for diagnostics by setting the "Level" property to "Debug (0)" on the appropriate diagnostic interface (Fig. 5).
